Exam 4: Demand and Supply
Exam 1: Getting Started347 Questions
Exam 2: The U.S.and Global Economies211 Questions
Exam 3: The Economic Problem283 Questions
Exam 4: Demand and Supply334 Questions
Exam 5: Elasticities of Demand and Supply342 Questions
Exam 6: Efficiency and Fairness of Markets364 Questions
Exam 7: Government Actions in Markets248 Questions
Exam 8: Taxes270 Questions
Exam 9: Global Markets in Action281 Questions
Exam 10: Externalities301 Questions
Exam 11: Public Goods and Common Resources180 Questions
Exam 12: Markets with Private Information103 Questions
Exam 13: Consumer Choice and Demand295 Questions
Exam 14: Production and Cost274 Questions
Exam 15: Perfect Competition285 Questions
Exam 16: Monopoly384 Questions
Exam 17: Monopolistic Competition221 Questions
Exam 18: Oligopoly228 Questions
Exam 19: Markets for Factors of Production188 Questions
Exam 20: Economic Inequality164 Questions
Select questions type
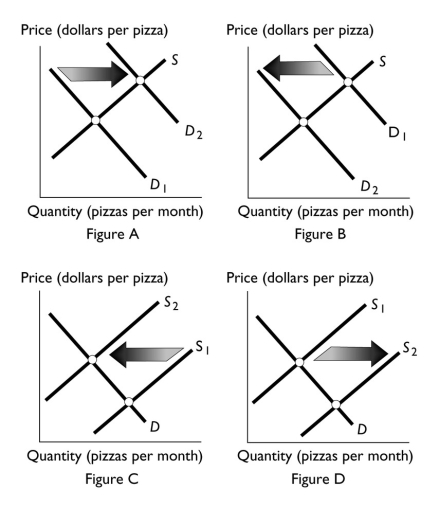 -Which figure above shows the effect if research is published claiming that eating pizza is healthy?
(Multiple Choice)
4.8/5  (36)
(36)
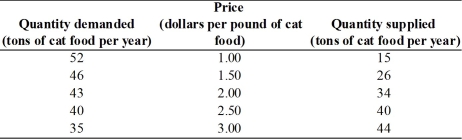 -The above table gives the demand and supply schedules for cat food.What is the equilibrium price and quantity?
(Essay)
4.8/5 (34)
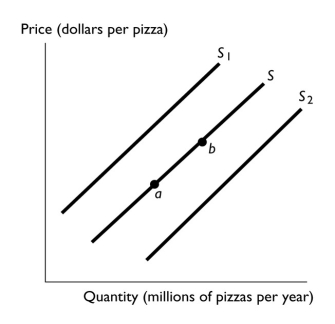 -In the above figure,the shift in the supply curve from S to S? reflects
(Multiple Choice)
4.9/5 (34)
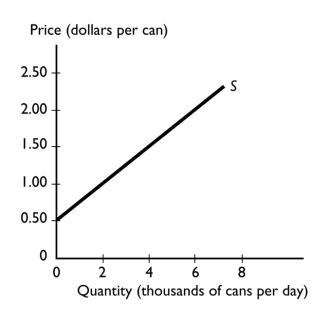 -The graph illustrates the supply of soda.If the price of soda rises from $0.50 a can to $1.50 a can,the quantity of soda supplied
(Multiple Choice)
4.8/5 (38)
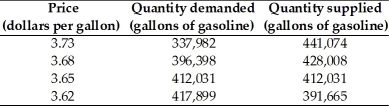 -The table above shows the situation in the gasoline market in Tulsa,Oklahoma.If the price of a gallon of gasoline is $3.65,then
(Multiple Choice)
4.9/5 (40)
Suppose Ramen noodles,an inexpensive but a quite tasty dish,are an inferior good.Why do grocery stores in college towns,that is,towns with a large fraction of college students,stock a lot of Ramen noodles?
(Essay)
4.9/5 (43)
If the price of carrots is below the equilibrium price,the
(Multiple Choice)
4.7/5 (25)
Other things remaining the same,the quantity of a good or service demanded will increase if the price of the good or service
(Multiple Choice)
4.9/5 (35)
Which of the following lowers the equilibrium price of a canoe?
(Multiple Choice)
4.9/5 (31)
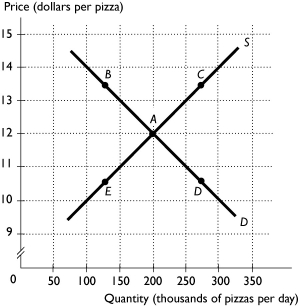 -The above figure shows the market for pizza.The market is in equilibrium when people's incomes decrease.If pizza is a normal good,then which point represents the most likely new price and quantity?
(Multiple Choice)
4.7/5 (38)
-Which figure above shows the effect of a decrease in the number of pizza sellers?
(Multiple Choice)
4.7/5 (39)
Bagels and cream cheese are complementary goods.Suppose that the price for flour,which is used to produce bagels,increases.The equilibrium price of cream cheese ________,and the equilibrium quantity of cream cheese ________.
(Multiple Choice)
4.9/5 (39)
Pizza and tacos are substitutes,and the price of a pizza increases.Which of the following correctly indicates what happens?
(Multiple Choice)
4.9/5 (39)
Oil refiners can refine a barrel of petroleum so that it yields either more home heating oil or more diesel fuel.If the price of diesel fuel falls,there is
(Multiple Choice)
4.7/5 (38)
Consider the market for leather shoes.If producers believe the price of leather shoes will increase next month,today
(Multiple Choice)
4.8/5 (37)
Smart phones are becoming less expensive as new technology reduces the cost of production.In a supply and demand model,explain the effects of the technological innovations and their effect on the quantity of smart phones.
(Essay)
4.8/5 (36)
The United Auto Workers bargained for higher wages and more benefits for autoworkers.As a result of the higher wages and increased benefits,
i.the quantity of new automobiles supplied decreases.
ii.the supply of new automobiles decreases.
iii.the supply of new automobiles increases.
(Multiple Choice)
4.9/5 (34)
Assume a competitive market is in equilibrium.There is an increase in demand,but no change in supply.As a result the equilibrium price ________,and the equilibrium quantity ________.
(Multiple Choice)
4.9/5 (37)
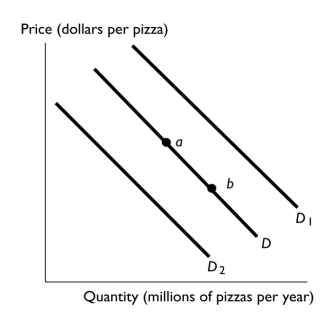 -In the above figure,the shift in the demand curve from D to D? can be the result of
(Multiple Choice)
4.9/5 (45)
Filters
- Essay(0)
- Multiple Choice(0)
- Short Answer(0)
- True False(0)
- Matching(0)