Multiple Choice
 In the above figure, ________ will shift the demand curve from D to D1.
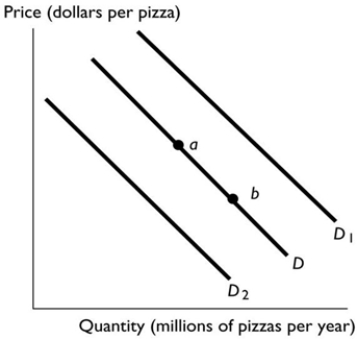
A) a fall in the cost of producing pizza
B) buyers' expectations that pizza will be less expensive next week
C) a scientific article published that demonstrates eating pizza is good for one's health
D) an increase in income if pizza is an inferior good
E) a decrease in the price of a sub sandwich, a substitute for pizza
Correct Answer:

Verified
Correct Answer:
Verified
Q31: Suppose improvements in technology cause the supply
Q32: <img src="https://d2lvgg3v3hfg70.cloudfront.net/TB7671/.jpg" alt=" Which figure above
Q33: <img src="https://d2lvgg3v3hfg70.cloudfront.net/TB7671/.jpg" alt=" The graph illustrates
Q34: <img src="https://d2lvgg3v3hfg70.cloudfront.net/TB7671/.jpg" alt=" Using the data
Q35: The quantity supplied of a good is<br>A)
Q37: <img src="https://d2lvgg3v3hfg70.cloudfront.net/TB7671/.jpg" alt=" The graph illustrates
Q38: A demand schedule<br>A) shows the quantity demanded
Q39: What happens to the demand for a
Q40: If there is a surplus of tacos,
Q41: The market demand curve for mousetraps is<br>A)