Multiple Choice
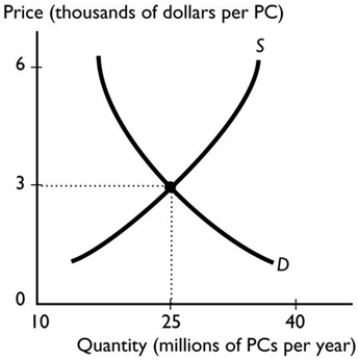 The graph illustrates the market for computers. If the number of buyers of computers increases and technology advances, you predict that the
A) equilibrium quantity of computers will decrease.
B) equilibrium price of a computer will fall.
C) equilibrium quantity of computers will increase.
D) equilibrium quantity of computers might increase, decrease or not change.
E) equilibrium price of a computer will rise.
Correct Answer:

Verified
Correct Answer:
Verified
Q32: <img src="https://d2lvgg3v3hfg70.cloudfront.net/TB7671/.jpg" alt=" Which figure above
Q33: <img src="https://d2lvgg3v3hfg70.cloudfront.net/TB7671/.jpg" alt=" The graph illustrates
Q34: <img src="https://d2lvgg3v3hfg70.cloudfront.net/TB7671/.jpg" alt=" Using the data
Q35: The quantity supplied of a good is<br>A)
Q36: <img src="https://d2lvgg3v3hfg70.cloudfront.net/TB7671/.jpg" alt=" In the above
Q38: A demand schedule<br>A) shows the quantity demanded
Q39: What happens to the demand for a
Q40: If there is a surplus of tacos,
Q41: The market demand curve for mousetraps is<br>A)
Q42: To be part of the supply for