Multiple Choice
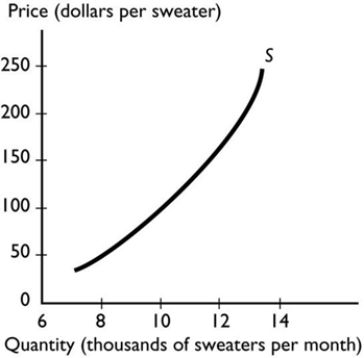 The graph illustrates the supply of sweaters. Which of the following events will increase the quantity supplied of sweaters?
A) A decrease in the number of sweater buyers.
B) A rise in the price of a sweater.
C) An increase in the number of sellers of sweaters.
D) A rise in the expected future price of a sweater.
E) A rise in the wage rate paid to the workers who make sweaters.
Correct Answer:

Verified
Correct Answer:
Verified
Q28: One reason supply curves have an upward
Q29: Using the data in the table above,
Q30: Which of the following shifts the supply
Q31: Suppose improvements in technology cause the supply
Q32: <img src="https://d2lvgg3v3hfg70.cloudfront.net/TB7671/.jpg" alt=" Which figure above
Q34: <img src="https://d2lvgg3v3hfg70.cloudfront.net/TB7671/.jpg" alt=" Using the data
Q35: The quantity supplied of a good is<br>A)
Q36: <img src="https://d2lvgg3v3hfg70.cloudfront.net/TB7671/.jpg" alt=" In the above
Q37: <img src="https://d2lvgg3v3hfg70.cloudfront.net/TB7671/.jpg" alt=" The graph illustrates
Q38: A demand schedule<br>A) shows the quantity demanded