Multiple Choice
 Which figure above shows the effect if research is published claiming that eating pizza is healthy?
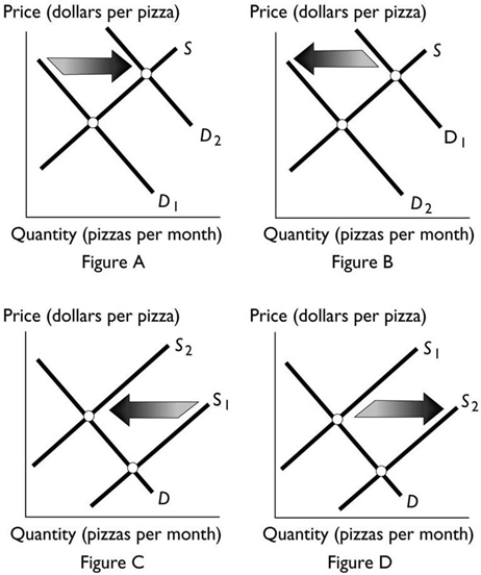
A) Figure A
B) Figure B
C) Figure C
D) Figure D
E) Both Figure A and Figure D
Correct Answer:

Verified
Correct Answer:
Verified
Q27: The market demand curve<br>A) cannot show a
Q28: One reason supply curves have an upward
Q29: Using the data in the table above,
Q30: Which of the following shifts the supply
Q31: Suppose improvements in technology cause the supply
Q33: <img src="https://d2lvgg3v3hfg70.cloudfront.net/TB7671/.jpg" alt=" The graph illustrates
Q34: <img src="https://d2lvgg3v3hfg70.cloudfront.net/TB7671/.jpg" alt=" Using the data
Q35: The quantity supplied of a good is<br>A)
Q36: <img src="https://d2lvgg3v3hfg70.cloudfront.net/TB7671/.jpg" alt=" In the above
Q37: <img src="https://d2lvgg3v3hfg70.cloudfront.net/TB7671/.jpg" alt=" The graph illustrates