Multiple Choice
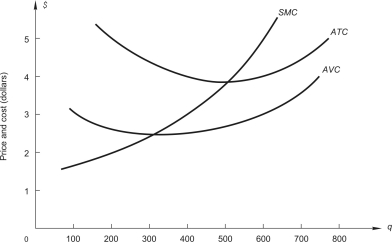 The graph above shows cost curves for a perfectly competitive firm.If market price is $2,how much profit will the firm earn?
A) $600
B) -$600
C) zero
D) $400
Correct Answer:

Verified
Correct Answer:
Verified
Related Questions
Q80: The graph below shows demand and marginal
Q81: Firms that employ exceptionally productive resources<br>A)have lower
Q82: Which of the following is NOT a
Q83: Radon Research Corporation (RRC)is one of
Q84: Consider a competitive industry and a
Q86: Below,the graph on the left shows the
Q87: The table below shows a competitive
Q88: In a perfectly competitive market<br>A)a firm must
Q89: Sport Tee Corporation manufactures T-shirts bearing
Q90: Below,the graph on the left shows long-run