Multiple Choice
The figure below shows a consumer maximizing utility at two different prices (the left panel) and the consumer's demand for good X at the same two prices of good X (the right panel) .The price of good Y is $4.50.At point R on the demand curve for X,the price of X is $____. 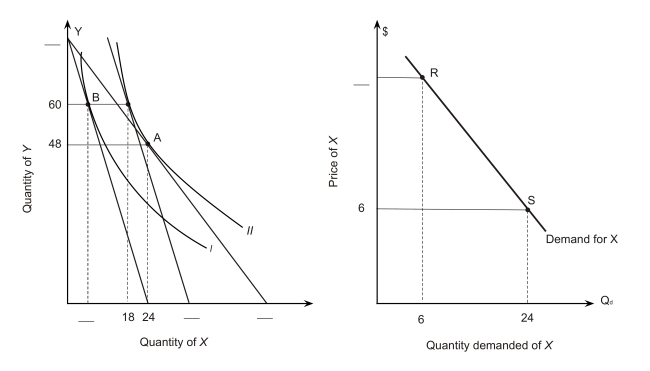
A) $8
B) $10
C) $12.50
D) $14
E) $15
Correct Answer:

Verified
Correct Answer:
Verified
Q31: The figure below shows a consumer maximizing
Q32: The ratio of the prices of two
Q33: The figure below shows a consumer maximizing
Q34: utility function<br>A)shows the relation between prices and
Q35: Market demand<br>A)is the horizontal summation of the
Q37: The following figure shows a portion of
Q38: The figure below shows a consumer maximizing
Q39: Mary prefers bananas to plums and plums
Q40: The following figure shows a portion of
Q41: In the following graph the consumer's income