Multiple Choice
The following figure shows a portion of a consumer's indifference map and budget lines.The price of good Y is $17 and the consumer's income is $7,650.Let the consumer begin in utility-maximizing equilibrium at point A on indifference curve II.Next the price of good X changes so that the consumer moves to a new utility-maximizing equilibrium at point B on indifference curve I.The income effect of the change in the price of X is 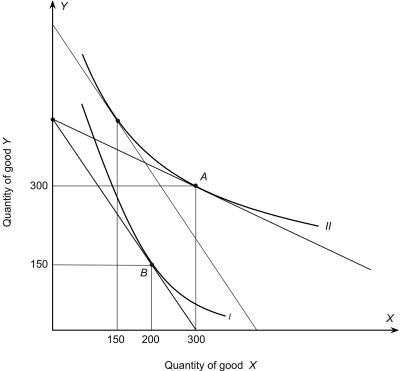
A) 50
B) 100
C) 150
D) -100
E) -150
Correct Answer:

Verified
Correct Answer:
Verified
Q32: The ratio of the prices of two
Q33: The figure below shows a consumer maximizing
Q34: utility function<br>A)shows the relation between prices and
Q35: Market demand<br>A)is the horizontal summation of the
Q36: The figure below shows a consumer maximizing
Q38: The figure below shows a consumer maximizing
Q39: Mary prefers bananas to plums and plums
Q40: The following figure shows a portion of
Q41: In the following graph the consumer's income
Q42: slope of an indifference curve<br>A)shows the change