Multiple Choice
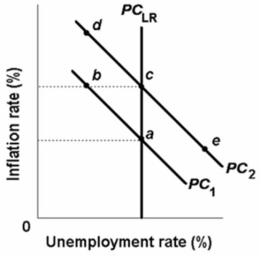 Refer to the above diagram.The move of the economy from c to e on short-run Phillips Curve PC2 would be explained by an:
A) increase in aggregate demand in the economy.
B) increase in aggregate supply in the economy.
C) actual rate of inflation that is less than the expected rate.
D) actual rate of inflation that exceeds the expected rate.
Correct Answer:

Verified
Correct Answer:
Verified
Q78: <img src="https://d2lvgg3v3hfg70.cloudfront.net/TB6686/.jpg" alt=" Refer to the
Q79: Refer to the graph below.The effects of
Q80: <img src="https://d2lvgg3v3hfg70.cloudfront.net/TB6686/.jpg" alt=" Refer to the
Q81: Based on the long-run Phillips Curve, any
Q82: In terms of aggregate supply, the difference
Q84: If the government attempts to maintain full
Q85: When the economy is experiencing cost-push inflation,
Q86: A rightward shift of The Phillips Curve
Q87: <img src="https://d2lvgg3v3hfg70.cloudfront.net/TB6686/.jpg" alt=" Refer to the
Q88: If prices and wages are flexible, a