Multiple Choice
The graph below shows the mean success rate of cutting down on smoking (positive score = success) in people who wanted to quit and people who did not want to quit.Which of the following statements is the most true? 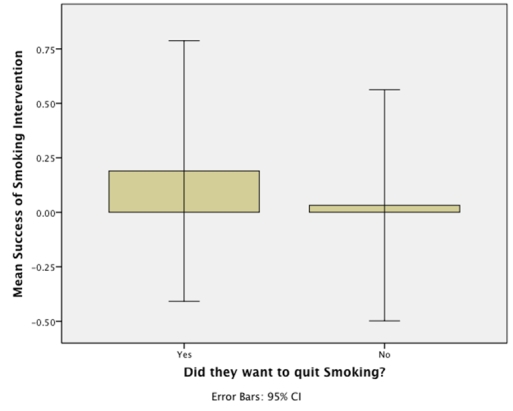
A) On average,people who wanted to quit were 25 times more successful than those who did not.
B) On average,success was six times higher in people who wanted to quit than in those who did not.
C) The average success was significantly higher in people who wanted to quit.
D) The effect in the population is likely to be the same for those who did and did not want to quit.
Correct Answer:

Verified
Correct Answer:
Verified
Q1: What is this graph known as? <img
Q2: We took a sample of children who
Q3: Looking at the graph below,which of the
Q4: Approximately what is the mean success score
Q6: Looking at the graph below,approximately what was
Q7: We took a sample of children who
Q8: What does the graph below show? <img
Q9: In IBM SPSS,what is this graph known
Q10: Approximately what is the median success score
Q11: What can we say about the graph