Essay
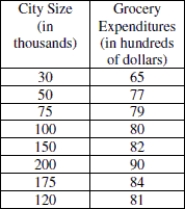
Use the data provided in the table below to answer the question. The table shows city size and annual grocery expenditures for eight families. City size is in thousands and expenditures is in hundreds of dollars.

-Based on the scatterplot, estimate the correlation coefficient between city size and expenditures for these eight families. Explain your reasons for choosing your estimate.
Correct Answer:

Verified
The calculated correlation coe...View Answer
Unlock this answer now
Get Access to more Verified Answers free of charge
Correct Answer:
Verified
View Answer
Unlock this answer now
Get Access to more Verified Answers free of charge
Q25: The data in the table represent the
Q26: The scatterplot below shows the hat size
Q27: The scatterplot below shows the number of
Q28: Suppose that runner height (in inches)and finish
Q29: If the correlation between whole milk content
Q31: r = - 0.3120<br>A) <img src="https://d2lvgg3v3hfg70.cloudfront.net/TB5647/.jpg" alt="r
Q32: State the slope and intercept of the
Q33: Which of the following statements regarding the
Q34: Which of the following statements regarding the
Q35: Use the regression equation to predict how