Multiple Choice
The data in the table represent the amount of raw material (in tons) put into an injection molding machine each day (x) , and the amount of scrap plastic (in tons) that is collected from the machine every four weeks (y) . Also shown below are the outputs from two different statistical technologies (TI- 83/84 Calculator and Excel) . A scatterplot of the data confirms that there is a linear association. Report the equation for predicting scrap from raw material using words such as scrap, not x and y. State the slope and intercept of the prediction equation. Round all calculations to the nearest hundredth. 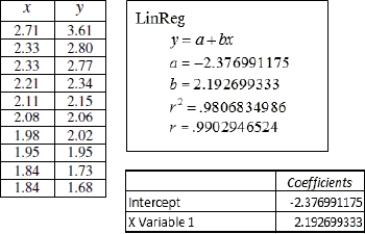
A) scrap = - 2.38 + 2.19(raw material) ; slope = 2.19 and the intercept is - 2.38.
B) scrap = 2.19 - 2.38(raw material) ; slope = - 2.38 and the intercept is 2.19.
C) scrap = 2.19 - 2.38(raw material) ; slope = 2.19 and the intercept is - 2.38.
D) scrap = - 2.38 + 2.19(raw material) ; slope = - 2.38 and the intercept is 2.19.
Correct Answer:

Verified
Correct Answer:
Verified
Q20: The scatterplot below shows the number of
Q21: The following model was created to show
Q22: The table shows the number of minutes
Q23: State the explanatory variable and the response
Q24: A horticulturist conducted an experiment on 120
Q26: The scatterplot below shows the hat size
Q27: The scatterplot below shows the number of
Q28: Suppose that runner height (in inches)and finish
Q29: If the correlation between whole milk content
Q30: Use the data provided in the table