Multiple Choice
The scatterplot below shows the hat size and IQ of some adults. Is the trend positive, negative, or near zero? 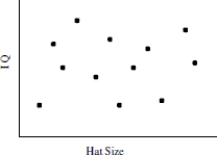
A) Positive
B) Near Zero
C) Negative
Correct Answer:

Verified
Correct Answer:
Verified
Related Questions
Q21: The following model was created to show
Q22: The table shows the number of minutes
Q23: State the explanatory variable and the response
Q24: A horticulturist conducted an experiment on 120
Q25: The data in the table represent the
Q27: The scatterplot below shows the number of
Q28: Suppose that runner height (in inches)and finish
Q29: If the correlation between whole milk content
Q30: Use the data provided in the table
Q31: r = - 0.3120<br>A) <img src="https://d2lvgg3v3hfg70.cloudfront.net/TB5647/.jpg" alt="r