Multiple Choice
The scatterplot below shows the number of tackles received and the number of concussions received for a team of football players for the most recent season. Choose the statement that best describes the trend. 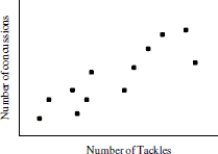
A) Teams that receive a greater number of tackles tend to have a higher number of concussions.
B) There is no association between the number of tackles a team receives and the number of concussions.
C) Teams that receive a greater number of tackles tend to receive a lower number of concussions.
Correct Answer:

Verified
Correct Answer:
Verified
Q22: The table shows the number of minutes
Q23: State the explanatory variable and the response
Q24: A horticulturist conducted an experiment on 120
Q25: The data in the table represent the
Q26: The scatterplot below shows the hat size
Q28: Suppose that runner height (in inches)and finish
Q29: If the correlation between whole milk content
Q30: Use the data provided in the table
Q31: r = - 0.3120<br>A) <img src="https://d2lvgg3v3hfg70.cloudfront.net/TB5647/.jpg" alt="r
Q32: State the slope and intercept of the