Short Answer
TABLE 2-9
The frequency distribution below represents the rents of 250 randomly selected federally subsidized apartments in a small town.
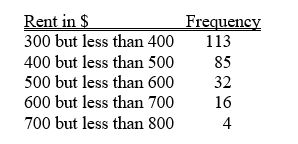
-Referring to Table 2-9, the relative frequency of the second class is ________.
Correct Answer:

Verified
85/250 or ...View Answer
Unlock this answer now
Get Access to more Verified Answers free of charge
Correct Answer:
Verified
View Answer
Unlock this answer now
Get Access to more Verified Answers free of charge
Q118: A histogram can have gaps between the
Q158: TABLE 2-12<br>The table below contains the opinions
Q160: TABLE 2-6<br>A sample of 200 students at
Q161: A side-by-side chart is two histograms plotted
Q162: TABLE 2-8<br>The Stem-and-Leaf display represents the number
Q164: TABLE 2-14<br>The table below contains the number
Q165: Retailers are always interested in determining why
Q166: TABLE 2-11<br>The ordered array below resulted from
Q167: TABLE 2-18<br>The stem-and-leaf display below shows the
Q168: TABLE 2-11<br>The ordered array below resulted from