Multiple Choice
The normal distribution curve which models, distributions of data in a wide range of applications, is given by the function
where and and are constants called the standard deviation and the mean, respectively. Its graph is shown in the figure. 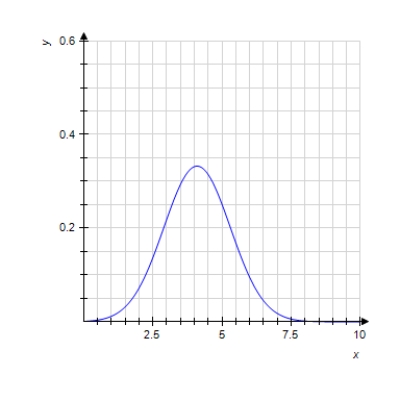 ?
?
In a survey, consumers were asked to rate a new toothpaste on a scale of 1-10. The resulting data are modeled by a normal distribution with and . The percentage of consumers who gave the toothpaste a score between a and b on the section is given by
Use a Riemann sum with n = 10 to estimate the percentage of customers who rated the toothpaste 5 or higher. (Use the range 4.5 to 10.5.) Round your answer to the nearest whole number.
A) 45%
B) 46%
C) 47%
D) 48%
E) 49%
Correct Answer:

Verified
Correct Answer:
Verified
Q56: Evaluate the integral. <span
Q57: Find <span class="ql-formula" data-value="f (
Q58: Evaluate the integral. <span
Q59: Evaluate the integral.
Q60: Evaluate the integral.<br><br> <span class="ql-formula"
Q61: The velocity of a particle moving
Q62: Evaluate the integral. <br>
Q63: Evaluate the integral. <span
Q64: Evaluate the integral. <span
Q65: Calculate the Riemann Sum for the