menu-iconExamlexExamLexServices

Discover

Ask a Question
  1. All Topics
  2. Topic
    Statistics
  3. Study Set
    Essentials of Business Analytics Study Set 1
  4. Exam
    Exam 3: Data Visualization
  5. Question
    The Following Image Is a ​ ​
Solved

The Following Image Is a ​ ​

Question 69

Question 69

Multiple Choice

The following image is a ​ The following image is a ​   ​ A) sparkline. B) trendline. C) gridline. D) line chart. ​
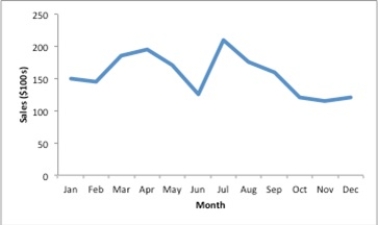

A) sparkline.
B) trendline.
C) gridline.
D) line chart.

Correct Answer:

verifed

Verified

Unlock this answer now
Get Access to more Verified Answers free of charge

Related Questions

Q10: DJ needs to display data over time.

Q22: A time series plot is also known

Q40: The best way to differentiate chart elements

Q59: This pie chart describes the age frequencies

Q60: The following table is an example

Q63: This Excel bar chart displays the demographics

Q64: The data on the distance walked

Q65: A consumer electronics company, after three

Q66: The project lead in an MNC decides

Q68: DJ needs to display data over time.

Examlex

ExamLex

About UsContact UsPerks CenterHomeschoolingTest Prep

Work With Us

Campus RepresentativeInfluencers

Links

FaqPricingChrome Extension

Download The App

Get App StoreGet Google Play

Policies

Privacy PolicyTerms of ServiceHonor CodeCommunity Guidelines

Scan To Download

qr-code

Copyright © (2025) ExamLex LLC.

Privacy PolicyTerms Of ServiceHonor CodeCommunity Guidelines