Multiple Choice
The histogram below represents the number of television sets per household for a sample of U.S. households. What is the sample size? Number of Television Sets Per U.S. Household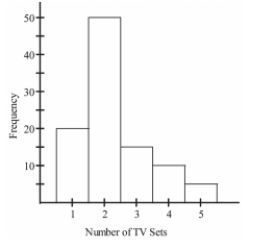
A) 100 households
B) 5 households
C) 50 households
D) 90 households
Correct Answer:

Verified
Correct Answer:
Verified
Related Questions
Q11: Which of the following cumulative frequency
Q12: A nurse measured the blood pressure
Q13: Graphs should be constructed in a way
Q14: The following frequency distribution represents the
Q15: A nurse measured the blood pressure
Q17: The following data show the number
Q18: The frequency table below shows the
Q19: The scatterplot below displays the amount of
Q20: <span class="ql-formula" data-value="\begin{array} { c c c
Q21: A school district performed a study