Multiple Choice
Which of these choices display the correct scatterplot?
A) 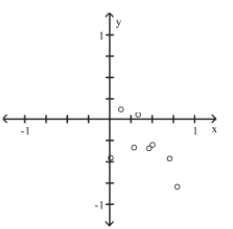
B) 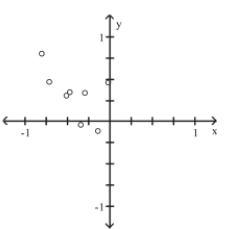
C) 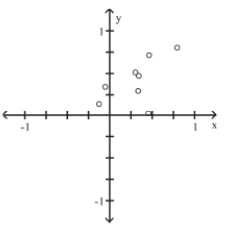
D) 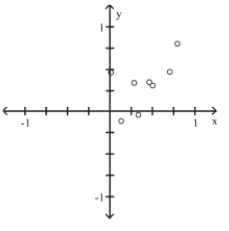
Correct Answer:

Verified
Correct Answer:
Verified
Related Questions
Q15: A nurse measured the blood pressure
Q16: The histogram below represents the number of
Q17: The following data show the number
Q18: The frequency table below shows the
Q19: The scatterplot below displays the amount of
Q21: A school district performed a study
Q22: The histogram below represents the number of
Q23: The ages of the 45 members
Q24: Analysis of the data from 25 mothers
Q25: Identify the cumulative frequency distribution that