Multiple Choice
A nurse measured the blood pressure of each person who visited her clinic. Following is a relative-frequency histogram for the systolic blood pressure readings for those people aged between 25 and 40 years. The blood pressure readings were given to the nearest
Whole number. Approximately what percentage of the people aged 25 -40 had a systolic
Blood pressure reading between 110 and 139 mm Hg inclusive? Systolic Blood Pressure for People Aged 25 - 40 Years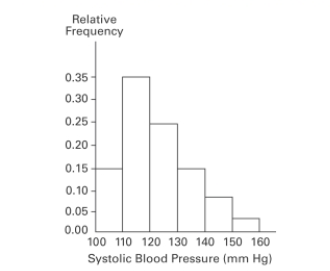
A)
B)
C)
D)
Correct Answer:

Verified
Correct Answer:
Verified
Q10: The frequency distribution below summarizes the
Q11: Which of the following cumulative frequency
Q12: A nurse measured the blood pressure
Q13: Graphs should be constructed in a way
Q14: The following frequency distribution represents the
Q16: The histogram below represents the number of
Q17: The following data show the number
Q18: The frequency table below shows the
Q19: The scatterplot below displays the amount of
Q20: <span class="ql-formula" data-value="\begin{array} { c c c