Multiple Choice
Which of the following presents the most honest graphical representation of the ratio "3 to 4"?
A) 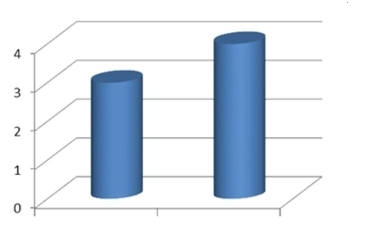
B) 
C) 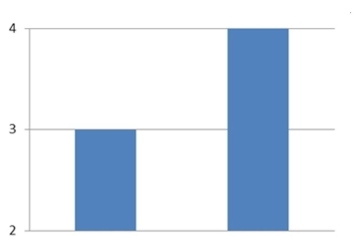
D) 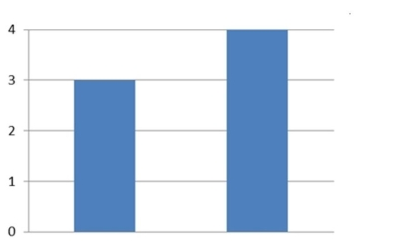
Correct Answer:

Verified
Correct Answer:
Verified
Related Questions
Q24: The following table presents the purchase
Q25: The following pie chart presents the percentages
Q26: The following frequency distribution presents the
Q27: The following frequency distribution presents the
Q28: Which of the following presents the most
Q29: The following table presents the purchase
Q30: A sample of 200 high school students
Q31: Following are the numbers of Dean's
Q32: The following frequency distribution presents the
Q33: Construct a stem-and-leaf plot for