Multiple Choice
Use the figure to answer the question.
-The heights (in inches) of a group of high school students are listed below in a back-to-back stem-and-leaf plot. 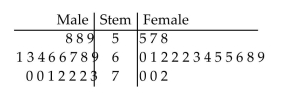
Which interval has the most students in it?
A) 70-79
B)
C)
D)
Correct Answer:

Verified
Correct Answer:
Verified
Related Questions
Q9: Identify whether the given scatterplot shows a
Q10: Use the circle graph to solve the
Q11: Use the figure to answer the question.<br>-The
Q12: Use the statistical display to answer the
Q13: Use the circle graph to solve the
Q15: Use the figure to answer the question.<br>-This
Q16: Use the figure to answer the question.<br>-The
Q17: Use the figure to answer the question.<br>-The
Q18: Use the figure to answer the
Q19: Use the figure to answer the