Multiple Choice
Use the circle graph to solve the problem.
-In a school survey, students showed these preferences for instructional materials. 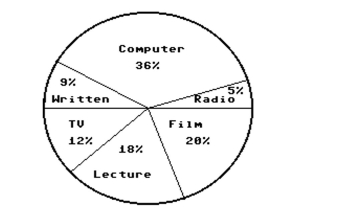 About how many students would you expect to prefer TV in a school of 500 students?
A) About 60 students
B) About 100 students
C) About 12 students
D) About 90 students
Correct Answer:

Verified
Correct Answer:
Verified
Q5: Use the statistical display to answer the
Q6: Use the statistical display to answer the
Q7: Use the figure to answer the question.<br>-The
Q8: Use the circle graph to solve the
Q9: Identify whether the given scatterplot shows a
Q11: Use the figure to answer the question.<br>-The
Q12: Use the statistical display to answer the
Q13: Use the circle graph to solve the
Q14: Use the figure to answer the
Q15: Use the figure to answer the question.<br>-This