Multiple Choice
Use the figure to answer the question.
-This double-bar graph shows the number of male (M) and female (F) athletes at a university over a four-year period. 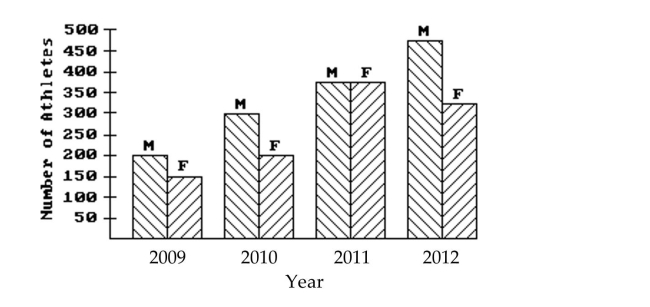 What is the only year in which the number of female athletes declined from its previous value?
A) 2012
B) 2009
C) 2010
D) 2011
Correct Answer:

Verified
Correct Answer:
Verified
Related Questions
Q10: Use the circle graph to solve the
Q11: Use the figure to answer the question.<br>-The
Q12: Use the statistical display to answer the
Q13: Use the circle graph to solve the
Q14: Use the figure to answer the
Q16: Use the figure to answer the question.<br>-The
Q17: Use the figure to answer the question.<br>-The
Q18: Use the figure to answer the
Q19: Use the figure to answer the
Q20: Use the figure to answer the question.<br>-The