Multiple Choice
Use the figure to answer the question.
-The sales figures for the Big "D" Company are shown below in a line graph. 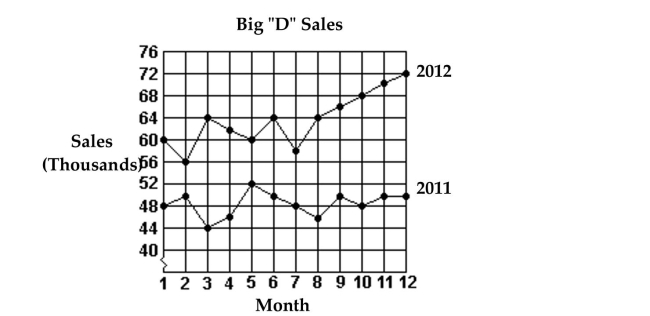 What were the total sales for the first 6 months of 2012?
A) $286,000
B) $64,000
C) $366,000
D) $302,000
Correct Answer:

Verified
Correct Answer:
Verified
Related Questions
Q6: Use the statistical display to answer the
Q7: Use the figure to answer the question.<br>-The
Q8: Use the circle graph to solve the
Q9: Identify whether the given scatterplot shows a
Q10: Use the circle graph to solve the
Q12: Use the statistical display to answer the
Q13: Use the circle graph to solve the
Q14: Use the figure to answer the
Q15: Use the figure to answer the question.<br>-This
Q16: Use the figure to answer the question.<br>-The