Multiple Choice
Use the figure to answer the question.
-This double-bar graph shows the number of male (M) and female (F) athletes at a university over a four-year period. 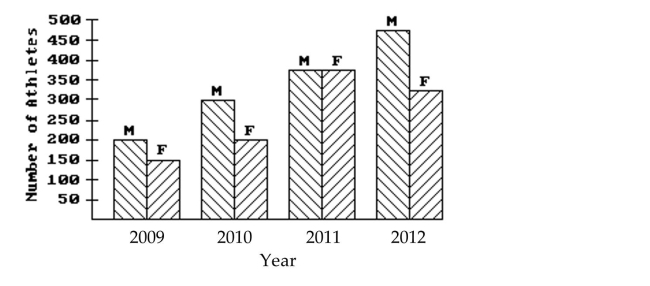 Which year had the same number of male and female athletes?
A) 2010
B) 2012
C) 2011
D) 2009
Correct Answer:

Verified
Correct Answer:
Verified
Related Questions
Q27: Use the statistical display to answer the
Q28: Use the circle graph to solve the
Q29: Use the figure to answer the question.<br>-The
Q30: Identify whether the given scatterplot shows a
Q31: Use the figure to answer the question.<br>-This
Q33: Use the figure to answer the question.<br>-The
Q34: Use the circle graph to solve the
Q35: Use the figure to answer the question.<br>-The
Q36: Use the statistical display to answer
Q37: Use the figure to answer the question.<br>-The