Multiple Choice
Use the figure to answer the question.
-The wages of the employees of a company are presented in this histogram. Assume that $6 is in the interval $6-$8, not $4-$6, similarly for $8, $10, and $12. 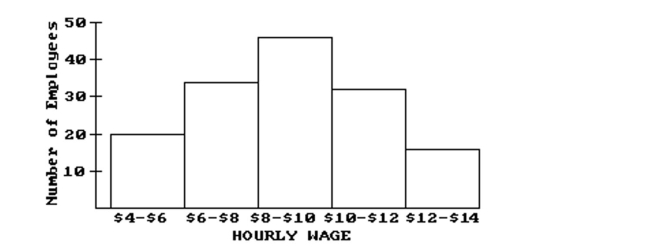 How many employees earn at least $6 and less than $8 an hour?
A) 20
B) 46
C) 34
D) 14
Correct Answer:

Verified
Correct Answer:
Verified
Q32: Use the figure to answer the question.<br>-This
Q33: Use the figure to answer the question.<br>-The
Q34: Use the circle graph to solve the
Q35: Use the figure to answer the question.<br>-The
Q36: Use the statistical display to answer
Q38: Identify whether the given scatterplot shows a
Q39: Use the figure to answer the
Q40: Use the figure to answer the question.<br>-The
Q41: Construct the requested statistical display.<br>-The attendance
Q42: Use the figure to answer the question.<br>-The