Multiple Choice
Use the circle graph to solve the problem.
-In a school survey, students showed these preferences for instructional materials. 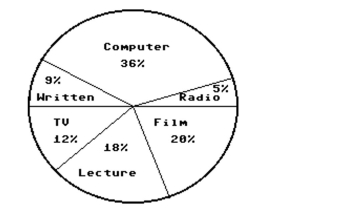 About how many students would you expect to prefer computers in a school of 500 students?
A) About 36 students
B) About 100 students
C) About 90 students
D) About 180 students
Correct Answer:

Verified
Correct Answer:
Verified
Q29: Use the figure to answer the question.<br>-The
Q30: Identify whether the given scatterplot shows a
Q31: Use the figure to answer the question.<br>-This
Q32: Use the figure to answer the question.<br>-This
Q33: Use the figure to answer the question.<br>-The
Q35: Use the figure to answer the question.<br>-The
Q36: Use the statistical display to answer
Q37: Use the figure to answer the question.<br>-The
Q38: Identify whether the given scatterplot shows a
Q39: Use the figure to answer the