Multiple Choice
Use the statistical display to answer the question.
-The midterm test scores for the seventh-period typing class are shown below on a dot plot. 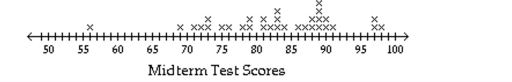
What are the low and high scores?
A)
B)
C)
D)
Correct Answer:

Verified
Correct Answer:
Verified
Related Questions
Q31: Use the figure to answer the question.<br>-This
Q32: Use the figure to answer the question.<br>-This
Q33: Use the figure to answer the question.<br>-The
Q34: Use the circle graph to solve the
Q35: Use the figure to answer the question.<br>-The
Q37: Use the figure to answer the question.<br>-The
Q38: Identify whether the given scatterplot shows a
Q39: Use the figure to answer the
Q40: Use the figure to answer the question.<br>-The
Q41: Construct the requested statistical display.<br>-The attendance