Multiple Choice
The graph below shows estimated world population for the period . Note that the logarithm of the world population and not actual population is plotted on the vertical axis. This means, for example, that when the graph reaches 7 on the vertical scale, world population is and when the graph reaches 9 on the vertical scale, world population is . 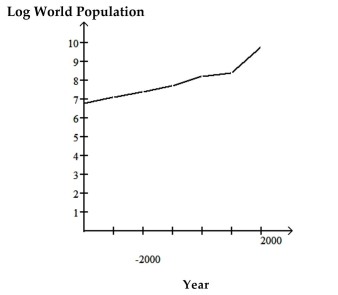 Use the graph to answer the question.
-How does world population in the year 1000 AD compare with world population in the year 2000 BC?
A) The 1000 AD population is roughly one million larger than the 2000 BC population.
B) The 1000 AD population is roughly 14% larger than the 2000 BC population.
C) The 1000 AD population is roughly ten million larger than the 2000 BC population.
D) The 1000 AD population is roughly ten times as large as the 2000 BC population.
Correct Answer:

Verified
Correct Answer:
Verified
Q172: Choose the best wording for the question
Q173: Use the guidelines to evaluate the study.
Q174: Construct a line chart for the
Q175: Use the guidelines to evaluate the study.
Q176: Answer the question.<br>-The bar graph below shows
Q178: Use the graph to answer the question.<br>-The
Q179: Make a scatter diagram for the
Q180: Describe how you would apply the five
Q181: State whether the scatter diagram shows strong
Q182: Provide an appropriate response.<br>-Construct a frequency table