Multiple Choice
Use the graph to answer the question.
-The following chart shows the percentage of cigarette smokers in Gotham City. 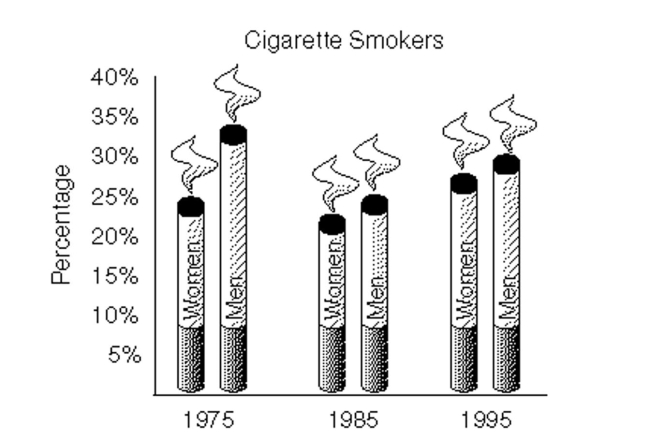 In which year does the percentage of men who smoke exceed the percentage of women who smoke by roughly 9 percentage points.
A) None of the above
B) 1975
C) 1995
D) 1985
Correct Answer:

Verified
Correct Answer:
Verified
Q173: Use the guidelines to evaluate the study.
Q174: Construct a line chart for the
Q175: Use the guidelines to evaluate the study.
Q176: Answer the question.<br>-The bar graph below shows
Q177: The graph below shows estimated world
Q179: Make a scatter diagram for the
Q180: Describe how you would apply the five
Q181: State whether the scatter diagram shows strong
Q182: Provide an appropriate response.<br>-Construct a frequency table
Q183: Use the graph to answer the question.<br>-<img