Multiple Choice
Construct a line chart for the data.
-The table shows the price of a volatile stock from the months January through December of the same year as determined by the closing price on the last trading day of the month. The price is
Rounded to the nearest dollar. 
A) 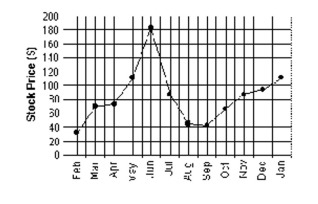
B) 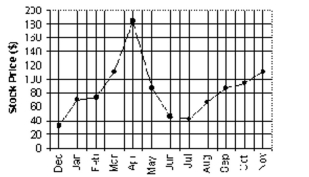
C) 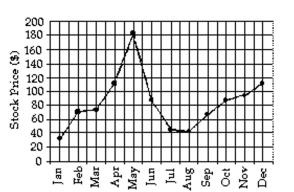
D) None of the above
Correct Answer:

Verified
Correct Answer:
Verified
Q169: State whether the scatter diagram shows strong
Q170: Identify the variable as either qualitative
Q171: Solve the problem.<br>-For the study described below,
Q172: Choose the best wording for the question
Q173: Use the guidelines to evaluate the study.
Q175: Use the guidelines to evaluate the study.
Q176: Answer the question.<br>-The bar graph below shows
Q177: The graph below shows estimated world
Q178: Use the graph to answer the question.<br>-The
Q179: Make a scatter diagram for the