Multiple Choice
The graph below shows estimated world population for the period 4000 BC = 2000 AD. Note that the logarithm of the world population and not actual population is plotted on the vertical axis. This means, for example, that when the graph reaches 7 on the vertical scale, world population is and when the graph reaches 9 on the vertical scale, world population is 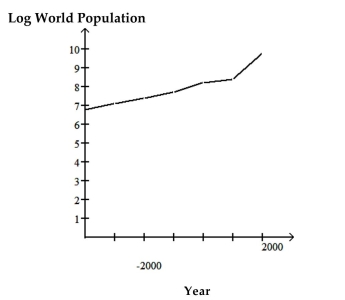 Use the graph to answer the question.
-How does world population in the year 2000 AD compare with world population in the year 4000 BC?
A) The 2000 AD population is roughly three billion larger than the 4000 BC population.
B) The 2000 AD population is roughly thirty times as large as the 4000 BC population.
C) The 2000 AD population is roughly 44% larger than the 4000 BC population.
D) The 2000 AD population is roughly one thousand times as large as the 4000 BC population.
Correct Answer:

Verified
Correct Answer:
Verified
Q1: Answer the question.<br>-Which of the following describes
Q2: Use the graph to answer the question.<br>-<img
Q4: Describe how you would apply the five
Q6: Use the guidelines to evaluate the study.
Q7: In order to answer the given question,
Q8: The stack plot below shows the value
Q9: Use the guidelines to evaluate the study.
Q10: Construct a pie chart representing the
Q11: Use the guidelines to evaluate the study.
Q119: Explain in your own words the difference