Multiple Choice
Use the graph to answer the question.
-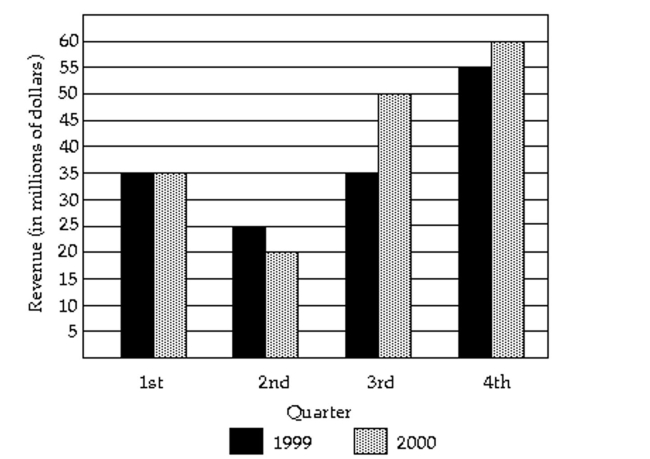 In what quarter was the revenue the least for 2000?
A) second quarter
B) fourth quarter
C) first quarter
D) third quarter
Correct Answer:

Verified
Correct Answer:
Verified
Related Questions
Q1: Answer the question.<br>-Which of the following describes
Q3: The graph below shows estimated world
Q4: Describe how you would apply the five
Q6: Use the guidelines to evaluate the study.
Q7: In order to answer the given question,
Q8: The stack plot below shows the value
Q9: Use the guidelines to evaluate the study.
Q10: Construct a pie chart representing the
Q11: Use the guidelines to evaluate the study.
Q119: Explain in your own words the difference