Multiple Choice
The following pie chart presents the percentages of fish caught in each of four ratings cate
Match this pie chart with its corresponding bar graph.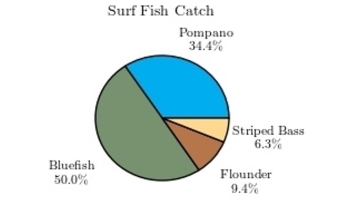
gories.
A) 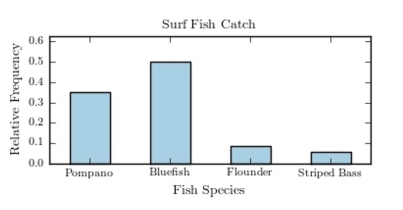
B) 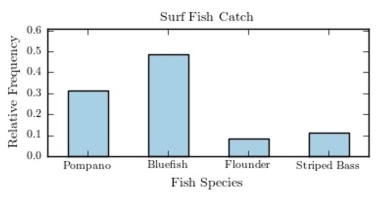
C) 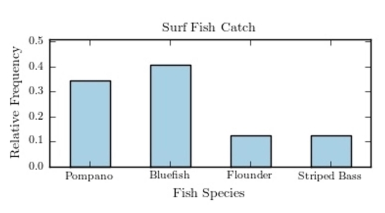
D) 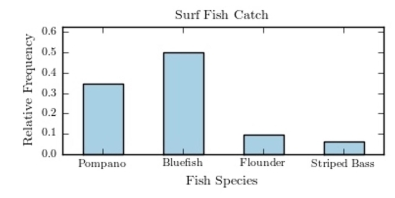
Correct Answer:

Verified
Correct Answer:
Verified
Related Questions
Q82: The following time-series plot presents the population
Q83: <span class="ql-formula" data-value="\text { Construct a stem-and-leaf
Q84: The frequency polygon and the histogram are
Q85: A sample of 200 high school
Q86: <span class="ql-formula" data-value="\text { Classify the histogram
Q88: The following information shows the colors
Q89: A Pareto chart is useful for showing
Q90: Following is a pie chart that
Q91: The following table presents the purchase
Q92: What is the upper class boundary of