Multiple Choice
A sample of 200 high school students were asked how many hours per week they spend u television. The following frequency distribution presents the results.
Construct a frequency polygon for the frequency distribution.
A) 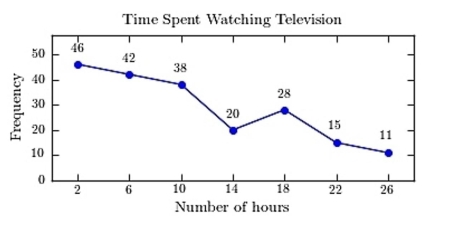
B) 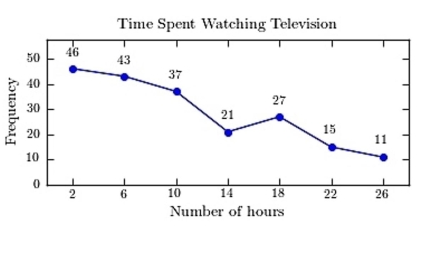
C) 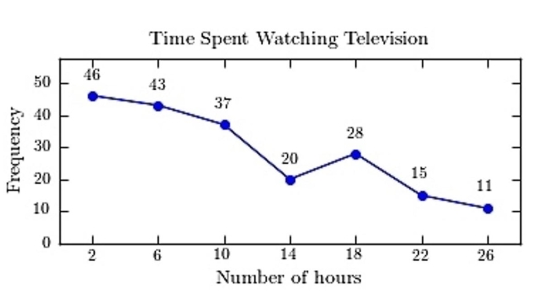
D) 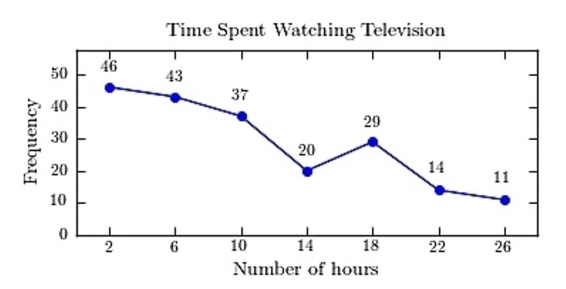
Correct Answer:

Verified
Correct Answer:
Verified
Q80: <span class="ql-formula" data-value="\begin{array}{l}\text { Given the following
Q81: When data are collected in original form,
Q82: The following time-series plot presents the population
Q83: <span class="ql-formula" data-value="\text { Construct a stem-and-leaf
Q84: The frequency polygon and the histogram are
Q86: <span class="ql-formula" data-value="\text { Classify the histogram
Q87: The following pie chart presents the percentages
Q88: The following information shows the colors
Q89: A Pareto chart is useful for showing
Q90: Following is a pie chart that