Multiple Choice
Which line chart below represents the data?
A) 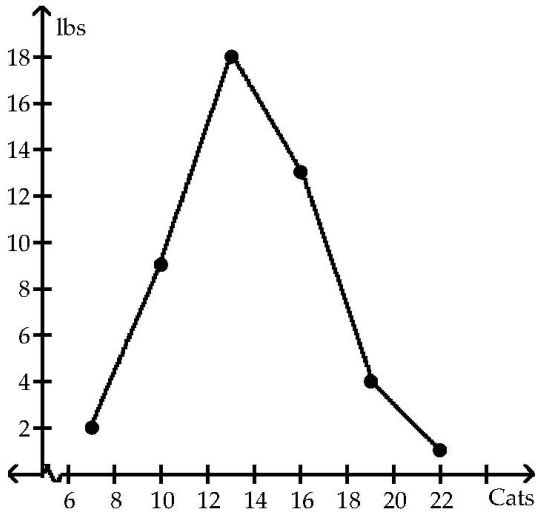
B) 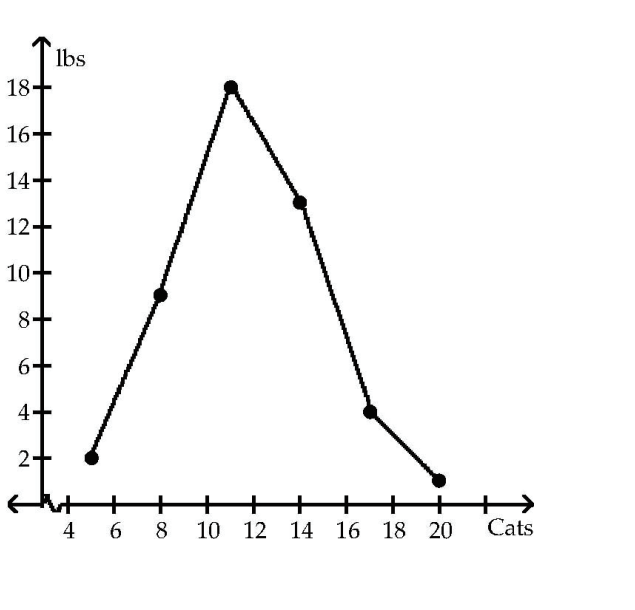
C) 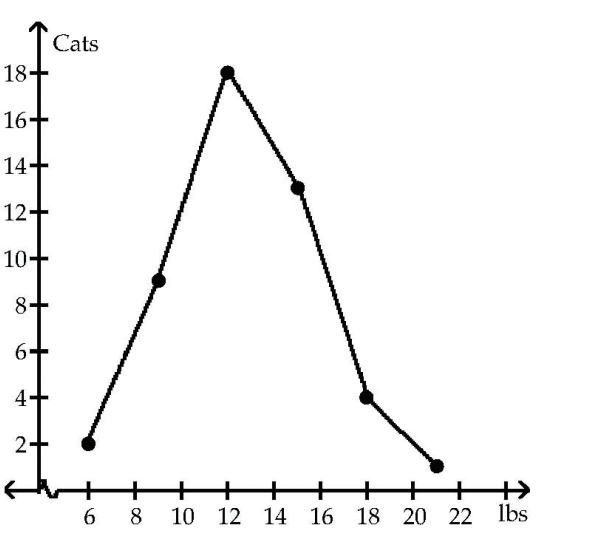
D) None of the above
Correct Answer:

Verified
Correct Answer:
Verified
Related Questions
Q29: The table shows the price of
Q30: The following multiple line graph shows the
Q31: The histogram below shows the ages of
Q32: After reviewing a movie, 400 people
Q33: The table lists the winners of
Q35: Which line chart below represents the
Q36: A medical research team studied the
Q37: Using the graphical display below.<br><img src="https://d2lvgg3v3hfg70.cloudfront.net/TB2967/.jpg" alt="Using
Q38: Construct a bar chart for the
Q39: The following dot plot represents the ages