Short Answer
After reviewing a movie, 400 people rated the movie as excellent, good, or fair. The following data give the rating distribution. Which pie chart below represents the given data set?
A)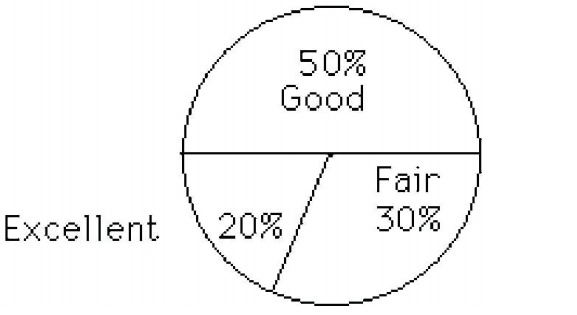
B)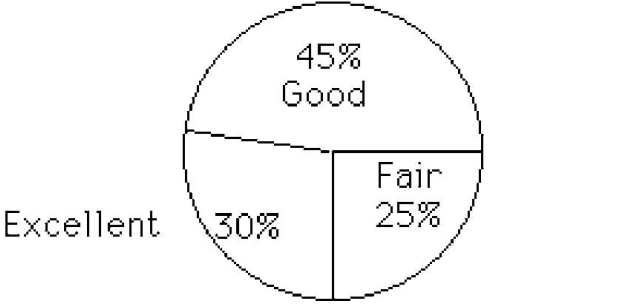
Correct Answer:

Verified
Correct Answer:
Verified
Q27: Find the original data from the
Q28: Using the graphical display below.<br> <img src="https://d2lvgg3v3hfg70.cloudfront.net/TB2967/.jpg"
Q29: The table shows the price of
Q30: The following multiple line graph shows the
Q31: The histogram below shows the ages of
Q33: The table lists the winners of
Q34: Which line chart below represents the
Q35: Which line chart below represents the
Q36: A medical research team studied the
Q37: Using the graphical display below.<br><img src="https://d2lvgg3v3hfg70.cloudfront.net/TB2967/.jpg" alt="Using