Multiple Choice
A nurse measured the blood pressure of each person who visited her clinic. Following is a relative-frequency histogram for the systolic blood pressure readings for those people
Aged between 25 and 40 years. The blood pressure readings were given to the nearest
Whole number. Approximately what percentage of the people aged 25 -40 had a systolic
Blood pressure reading between 110 and 139 mm Hg inclusive? Systolic Blood Pressure for People Aged 25-40 Years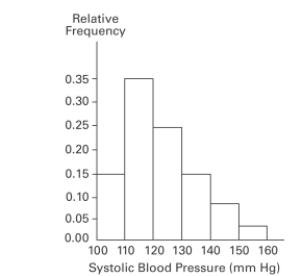
A) 59%
B) 39%
C) 89%
D) 75%
Correct Answer:

Verified
Correct Answer:
Verified
Q2: The frequency distribution below summarizes the
Q4: The frequency distribution below summarizes the
Q4: Describe the differences between a histogram and
Q6: The histogram below represents the number of
Q7: The histogram below represents the number
Q8: The following data represent the number
Q9: The scatterplot below displays the amount of
Q10: The weights (in pounds)of 22 members
Q11: A nurse measured the blood pressure of
Q34: A bar chart and a Pareto chart