Multiple Choice
The Excel frequency bar graph below describes the employment status of a random sample of U.S. adults. What is the percentage of those having no job 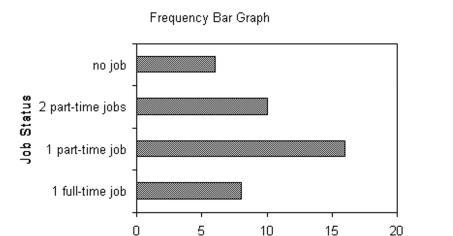
A)
B)
C)
D) cannot determine The following double-bar graph illustrates the revenue for a company for the four quarters of the year for two different years.
Correct Answer:

Verified
Correct Answer:
Verified
Q29: The pie chart shows the percentage
Q30: The sum of all the relative frequencies
Q31: Construct Frequency Polygons<br>- <span class="ql-formula" data-value="\begin{array}
Q32: The pie chart shows the percentage
Q33: Describe What Can Make a Graph
Q35: Draw Dot Plots<br>-The heights (in inches)
Q36: Use the graph to answer the question.
Q37: Describe What Can Make a Graph Misleading
Q38: Identify the Shape of a Distribution<br>-<img src="https://d2lvgg3v3hfg70.cloudfront.net/TB6005/.jpg"
Q39: The pie chart shows the percentage