Multiple Choice
Use the graph to answer the question. 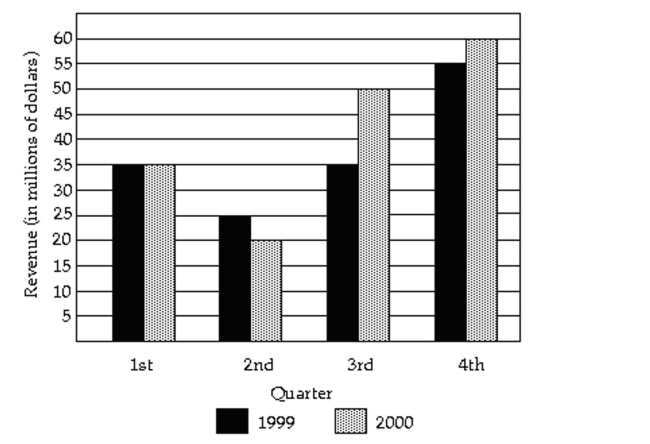
-In what quarter was the revenue the least for 1999
A) second quarter
B) first quarter
C) fourth quarter
D) third quarter
Correct Answer:

Verified
Correct Answer:
Verified
Related Questions
Q31: Construct Frequency Polygons<br>- <span class="ql-formula" data-value="\begin{array}
Q32: The pie chart shows the percentage
Q33: Describe What Can Make a Graph
Q34: The Excel frequency bar graph below
Q35: Draw Dot Plots<br>-The heights (in inches)
Q37: Describe What Can Make a Graph Misleading
Q38: Identify the Shape of a Distribution<br>-<img src="https://d2lvgg3v3hfg70.cloudfront.net/TB6005/.jpg"
Q39: The pie chart shows the percentage
Q40: Create Cumulative Frequency and Relative Frequency
Q41: Describe What Can Make a Graph Misleading