Essay
Describe What Can Make a Graph Misleading or Deceptive
-The following graph shows the number of car accidents occurring in one city in each of the years 2001 through 2006. The number of accidents dropped in 2003 after a new speed limit was imposed. How is the bar graph misleading How would you redesign the graph to be less misleading 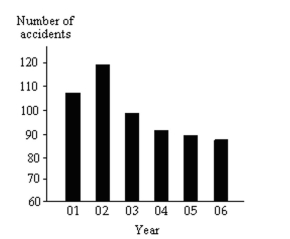
Correct Answer:

Verified
The bar graph is misleading because the ...View Answer
Unlock this answer now
Get Access to more Verified Answers free of charge
Correct Answer:
Verified
View Answer
Unlock this answer now
Get Access to more Verified Answers free of charge
Q32: The pie chart shows the percentage
Q33: Describe What Can Make a Graph
Q34: The Excel frequency bar graph below
Q35: Draw Dot Plots<br>-The heights (in inches)
Q36: Use the graph to answer the question.
Q38: Identify the Shape of a Distribution<br>-<img src="https://d2lvgg3v3hfg70.cloudfront.net/TB6005/.jpg"
Q39: The pie chart shows the percentage
Q40: Create Cumulative Frequency and Relative Frequency
Q41: Describe What Can Make a Graph Misleading
Q42: The pie chart shows the percentage