Multiple Choice
Describe What Can Make a Graph Misleading or Deceptive
-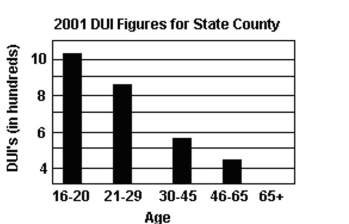
A) The graphic may give the impression that drivers over age 65 had no DUI's in
B) The graphic only includes information for one year.
C) The horizontal scale does not begin at zero.
D) The graphic is not misleading.
Correct Answer:

Verified
Correct Answer:
Verified
Q29: The pie chart shows the percentage
Q30: The sum of all the relative frequencies
Q31: Construct Frequency Polygons<br>- <span class="ql-formula" data-value="\begin{array}
Q32: The pie chart shows the percentage
Q33: What is the difference between a bar
Q34: The Excel frequency bar graph below
Q35: Draw Dot Plots<br>-The heights (in inches)
Q36: Use the graph to answer the question.
Q37: Describe What Can Make a Graph Misleading
Q38: Identify the Shape of a Distribution<br>-<img src="https://d2lvgg3v3hfg70.cloudfront.net/TB6005/.jpg"