menu-iconExamlexExamLexServices

Discover

Ask a Question
  1. All Topics
  2. Topic
    Statistics
  3. Study Set
    Stats Data and Models Study Set 2
  4. Exam
    Exam 4: Understanding and Comparing Distributions
  5. Question
    The Side-By-Side Boxplots Show the Cumulative College GPAs for Sophomores
Solved

The Side-By-Side Boxplots Show the Cumulative College GPAs for Sophomores

Question 7

Question 7

Multiple Choice

The side-by-side boxplots show the cumulative college GPAs for sophomores, juniors, and seniors taking an intro stats course in Autumn 2003. The side-by-side boxplots show the cumulative college GPAs for sophomores, juniors, and seniors taking an intro stats course in Autumn 2003.   What is the approximate value of the largest range for GPA? A) 0.8 B) 1.0 C) 1.4 D) 2.4 E) 3.0 What is the approximate value of the largest range for GPA?
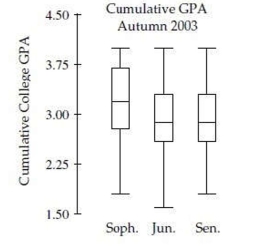

A) 0.8
B) 1.0
C) 1.4
D) 2.4
E) 3.0

Correct Answer:

verifed

Verified

Unlock this answer now
Get Access to more Verified Answers free of charge

Related Questions

Q2: At www.census.gov you can create a "population

Q3: One thousand students from a local university

Q4: The side-by-side boxplots show the cumulative college

Q5: The boxplots show prices of used cars

Q6: The side-by-side boxplots show the cumulative college

Q8: The following boxplots show monthly sales revenue

Q9: The boxplots show prices of used cars

Q10: The following boxplots show monthly sales revenue

Q11: At www.census.gov you can create a "population

Q12: The side-by-side boxplots show the cumulative college

Examlex

ExamLex

About UsContact UsPerks CenterHomeschoolingTest Prep

Work With Us

Campus RepresentativeInfluencers

Links

FaqPricingChrome Extension

Download The App

Get App StoreGet Google Play

Policies

Privacy PolicyTerms of ServiceHonor CodeCommunity Guidelines

Scan To Download

qr-code

Copyright © (2025) ExamLex LLC.

Privacy PolicyTerms Of ServiceHonor CodeCommunity Guidelines