Multiple Choice
At www.census.gov you can create a "population pyramid" for any country.These pyramids are back-to-back histograms.This pyramid shows Mexico's 2000 female population and the
Census bureau's projection for 2050.Check all that apply. 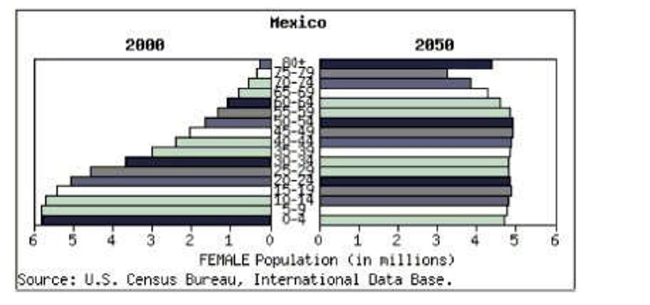
A) The expected mean age in 2050 is higher than the mean age in 2000.
B) The expected median age in 2050 is higher than the median age in 2000.
C) The expected mean age in 2050 is lower than the mean age in 2000.
D) The expected median age in 2050 is lower than the median age in 2000.
E) The IQR of the distribution of projected ages in 2050 is larger than the IQR of the distribution of ages in 2000.
Correct Answer:

Verified
Correct Answer:
Verified
Q1: The boxplots show prices of used cars
Q3: One thousand students from a local university
Q4: The side-by-side boxplots show the cumulative college
Q5: The boxplots show prices of used cars
Q6: The side-by-side boxplots show the cumulative college
Q7: The side-by-side boxplots show the cumulative college
Q8: The following boxplots show monthly sales revenue
Q9: The boxplots show prices of used cars
Q10: The following boxplots show monthly sales revenue
Q11: At www.census.gov you can create a "population