Multiple Choice
The side-by-side boxplots show the cumulative college GPAs for sophomores, juniors, and seniors taking an intro stats course in Autumn 2003. 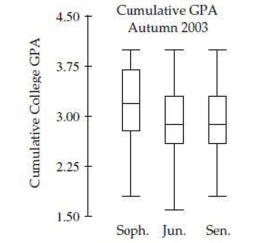 Which class has the most skewed set of GPAs?
A) Sophomore
B) Junior
C) Senior
D) Both Junior and Senior
E) Both Sophomore and Junior
Correct Answer:

Verified
Correct Answer:
Verified
Q1: The boxplots show prices of used cars
Q2: At www.census.gov you can create a "population
Q3: One thousand students from a local university
Q5: The boxplots show prices of used cars
Q6: The side-by-side boxplots show the cumulative college
Q7: The side-by-side boxplots show the cumulative college
Q8: The following boxplots show monthly sales revenue
Q9: The boxplots show prices of used cars
Q10: The following boxplots show monthly sales revenue
Q11: At www.census.gov you can create a "population