Multiple Choice
One thousand students from a local university were sampled to gather information such as gender, high school GPA, college GPA, and total SAT scores.The results were used to create
Histograms displaying high school grade point averages (GPAs) for both males and females.
Compare the grade distribution of males and females.Check all that apply. 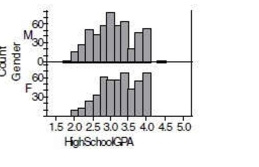
A) Both distributions are skewed to the left.
B) Both distributions appear to be centered at a GPA of about 3.0.
C) The distributions are skewed in different directions.
D) The distributions are differ strongly in center.
E) The distribution of male GPA appears slightly more spread out than the distribution of female GPA
Correct Answer:

Verified
Correct Answer:
Verified
Q1: The boxplots show prices of used cars
Q2: At www.census.gov you can create a "population
Q4: The side-by-side boxplots show the cumulative college
Q5: The boxplots show prices of used cars
Q6: The side-by-side boxplots show the cumulative college
Q7: The side-by-side boxplots show the cumulative college
Q8: The following boxplots show monthly sales revenue
Q9: The boxplots show prices of used cars
Q10: The following boxplots show monthly sales revenue
Q11: At www.census.gov you can create a "population