Multiple Choice
The following frequency distribution presents the frequency of passenger vehicles that pass through a certain intersection from 8:00 AM to 9:00 AM on a particular day. Construct a relative frequency Pareto chart for the data.
A) 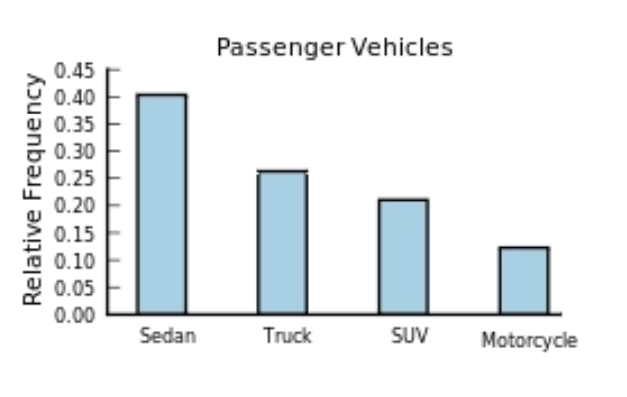
B) 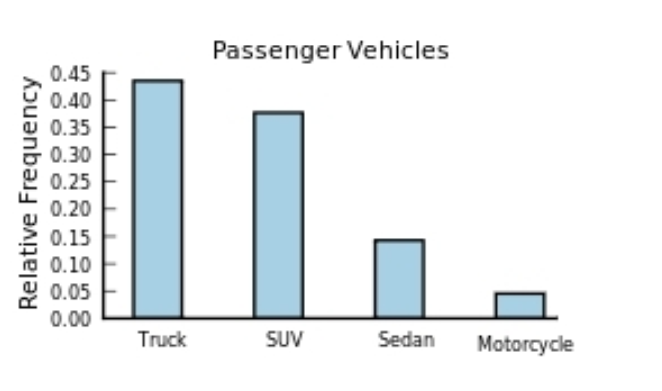
C) 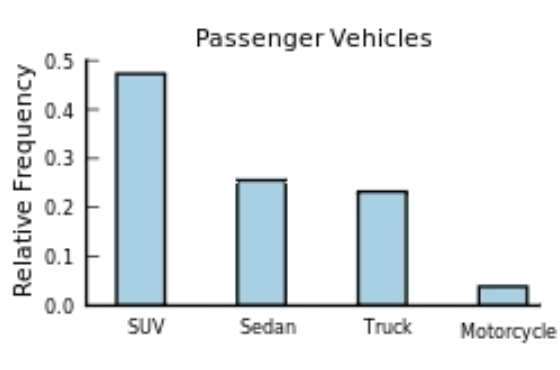
D) 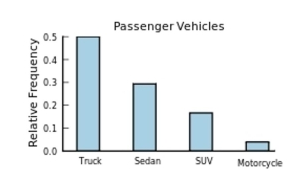
Correct Answer:

Verified
Correct Answer:
Verified
Related Questions
Q9: The amounts 5 and 2 are compared.
Q10: Gravity on Mars: The gravity on Earth
Q11: The following time-series plot presents the population
Q12: The amounts 3 and 2 are compared.
Q13: Thirty households were surveyed for the
Q15: A sample of 200 high school
Q16: Construct a stem-and-leaf plot for the
Q17: Toy sales: The following graph presents the
Q18: A sample of 200 high school
Q19: The following frequency distribution presents the