Multiple Choice
Thirty households were surveyed for the number of televisions in each home. Following are the results.
Construct a relative frequency histogram.
A) 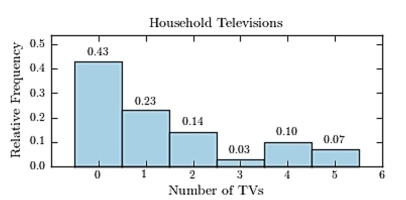
B) 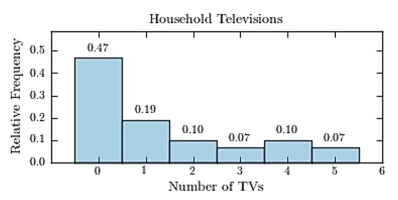
C) 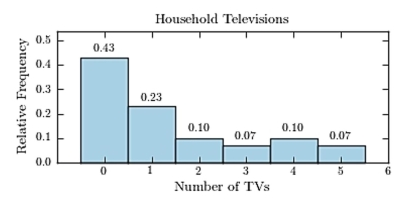
D) 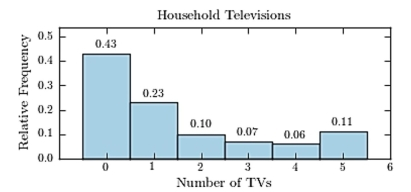
Correct Answer:

Verified
Correct Answer:
Verified
Related Questions
Q8: Construct a dotplot for the following
Q9: The amounts 5 and 2 are compared.
Q10: Gravity on Mars: The gravity on Earth
Q11: The following time-series plot presents the population
Q12: The amounts 3 and 2 are compared.
Q14: The following frequency distribution presents the
Q15: A sample of 200 high school
Q16: Construct a stem-and-leaf plot for the
Q17: Toy sales: The following graph presents the
Q18: A sample of 200 high school