Multiple Choice
A sample of 200 high school students were asked how many hours per week they spend watching television. The following frequency distribution presents the results. Construct a frequency polygon for the frequency distribution.
A) 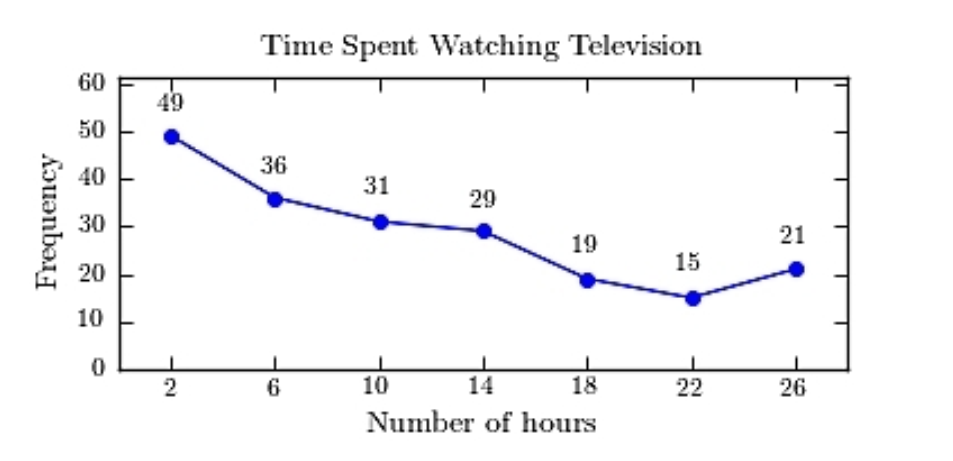
B) 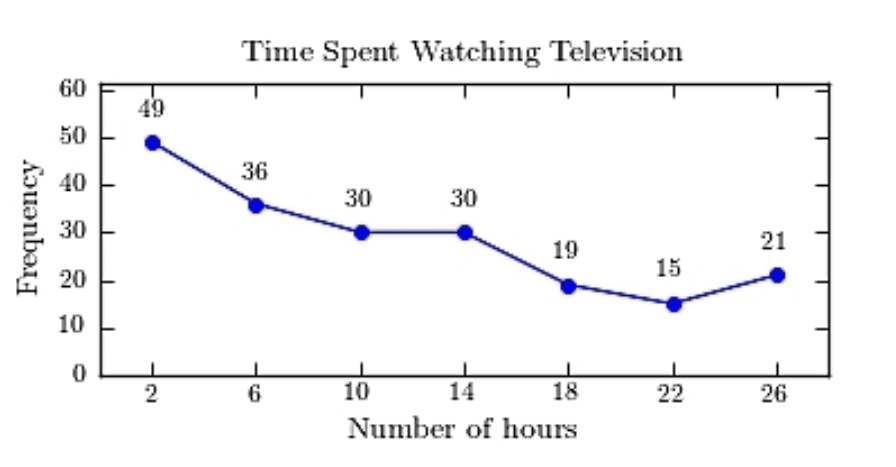 .
.
C) 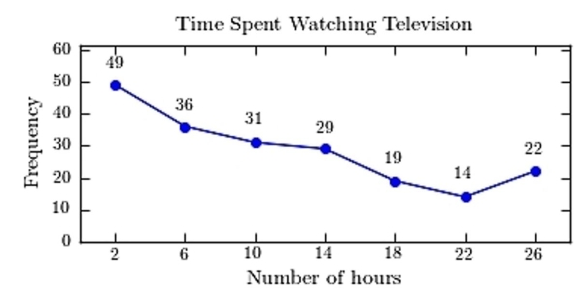
D) 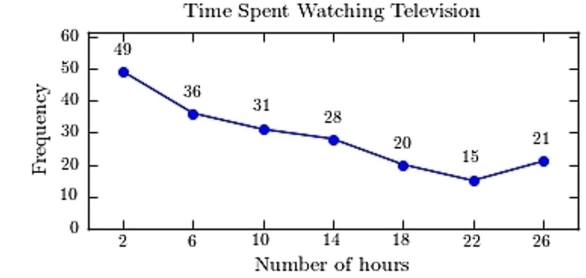 .
.
Correct Answer:

Verified
Correct Answer:
Verified
Related Questions
Q13: Thirty households were surveyed for the
Q14: The following frequency distribution presents the
Q15: A sample of 200 high school
Q16: Construct a stem-and-leaf plot for the
Q17: Toy sales: The following graph presents the
Q19: The following frequency distribution presents the
Q20: The following pie chart presents the percentages
Q21: The following frequency distribution presents the
Q22: The following table presents the purchase
Q23: Helium prices: The cost of grade A